07 · LEAN
LEAN toolkit
Integrated LEAN tools for continuous improvement of production processes. All modules are interconnected and share a common database for complete traceability — from 5S audits and Kaizen proposals, through Gemba walks, to systemic problem solving via A3 reports. Photos, observations and actions are linked to workers, machines and locations.
View · 01
New 5S Audit: structured form with zone, auditor, date, department and shift, and 5 sections (Sort, Set in Order, Shine, Standardize, Sustain)
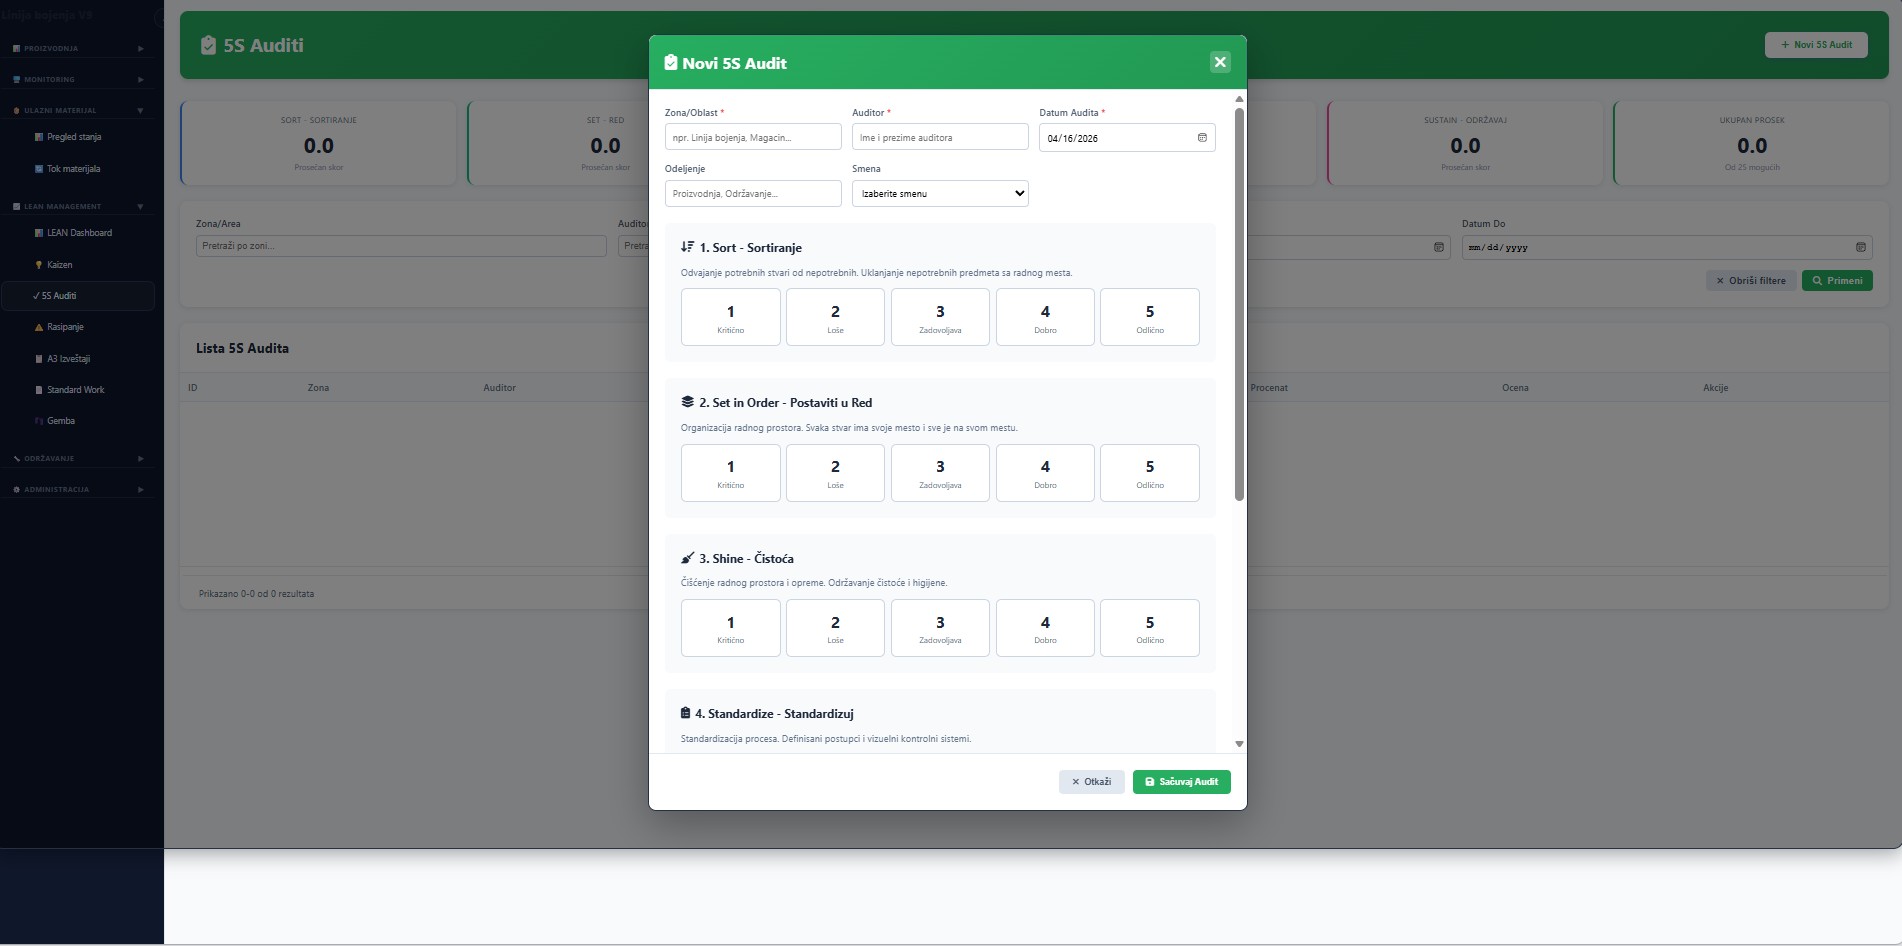
Figure 16 — New 5S Audit: structured form with zone, auditor, date, department and shift, and 5 sections (Sort, Set in Order, Shine, Standardize, Sustain) — each with a 1–5 scale (Critical / Poor / Adequate / Good / Excellent)
All 5 phases on one form
Sort, Set in Order, Shine, Standardize, Sustain — all rated together, average is computed on the fly and written to the main audit table.
Visual 1–5 scale
Big colour-coded buttons with labels (Critical → Excellent) — the auditor rates quickly without ambiguity about what "3" means.
Zone × Shift cross-section
Every audit is tied to a zone (coating line, warehouse) and a shift — so differences in discipline between shifts become visible.
Auto-computed total average
Average score (out of 25 possible) is calculated and published to the LEAN Dashboard with no extra input.
View · 02
New Kaizen Proposal: form with title, category, priority, department, shift, current situation, proposed improvement, expected benefits, estimated cost and savings in RSD, implementation date and reviewer comment
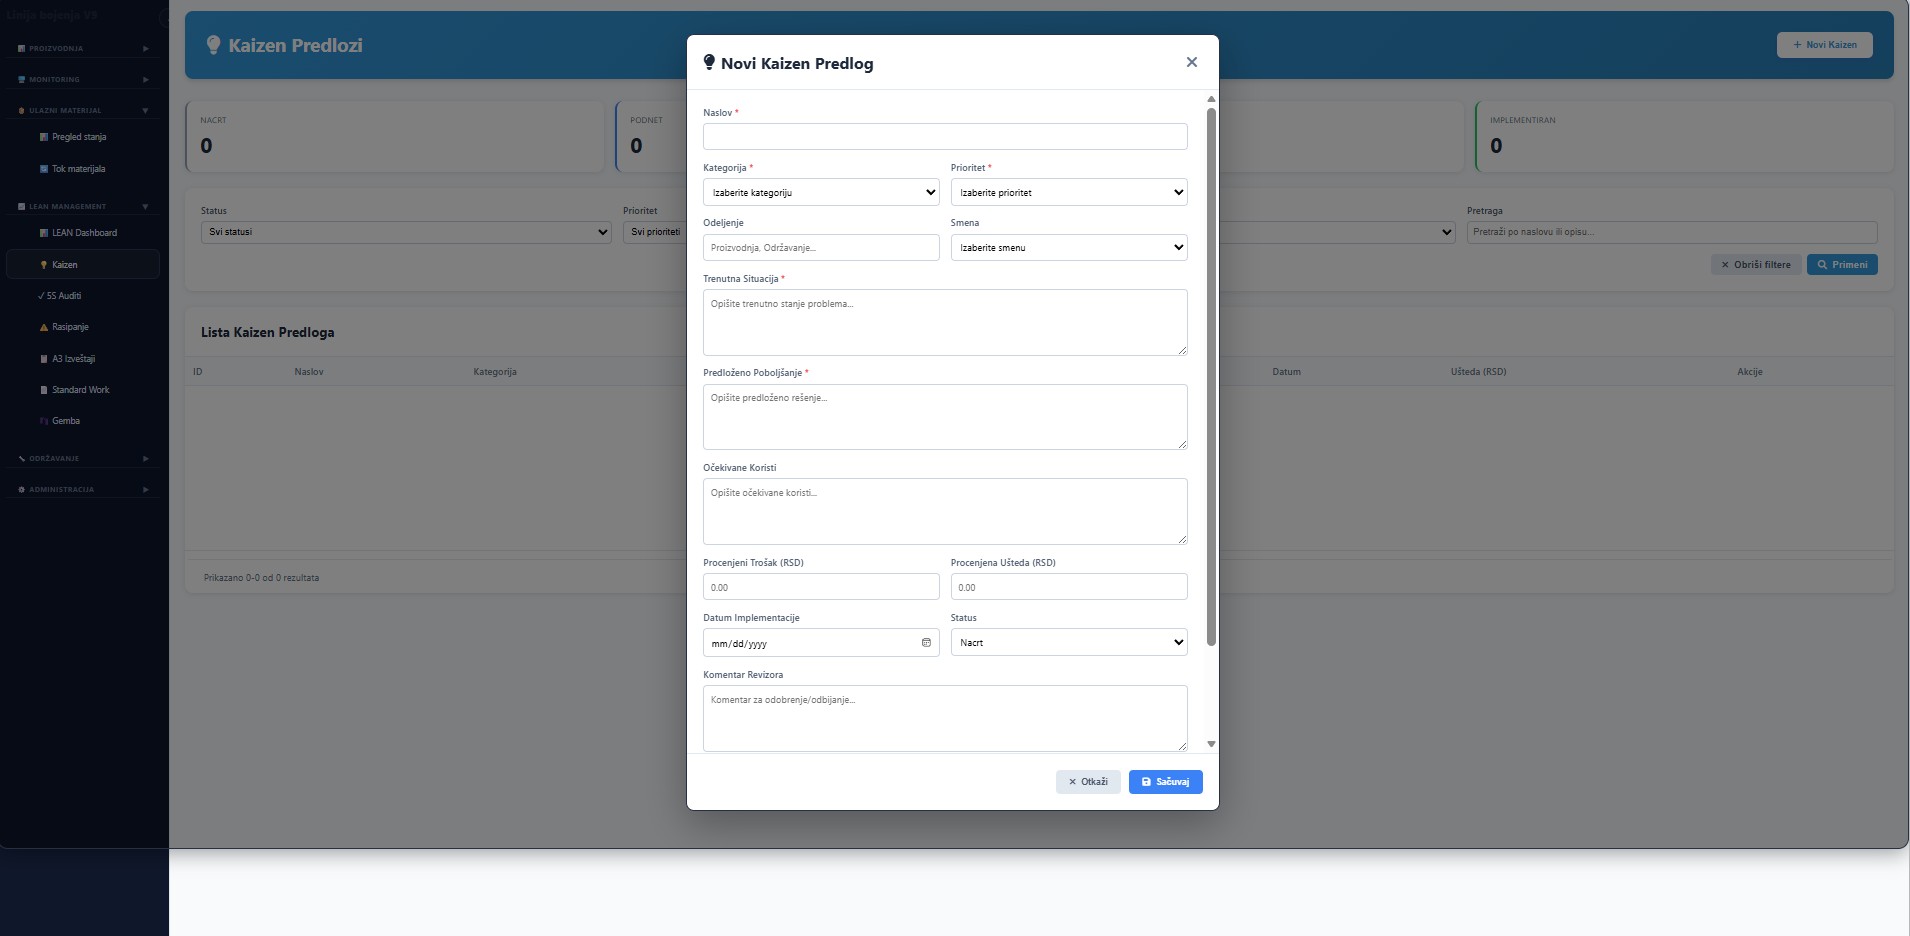
Figure 17 — New Kaizen Proposal: form with title, category, priority, department, shift, current situation, proposed improvement, expected benefits, estimated cost and savings in RSD, implementation date and reviewer comment
Current situation → Proposal → Benefit
A structure that makes the proposer think about the problem, not just drop a one-liner idea.
Cost and savings in RSD
Estimated Cost (RSD) and Estimated Savings (RSD) fields — Kaizen ROI is measurable from day one.
Review workflow
Status Draft → Submitted → Approved → Implemented, with mandatory reviewer comment on approve/reject.
Categorization and priority
Category (Safety, Quality, Productivity, Ergonomics, Cost) and priority — filters in the Kaizen proposal list.
View · 03
New Gemba Walk: structured shop-floor walk form with observation type (Safety / Quality / Waste), location, shift, observations, findings (positive and negative) and improvement suggestions
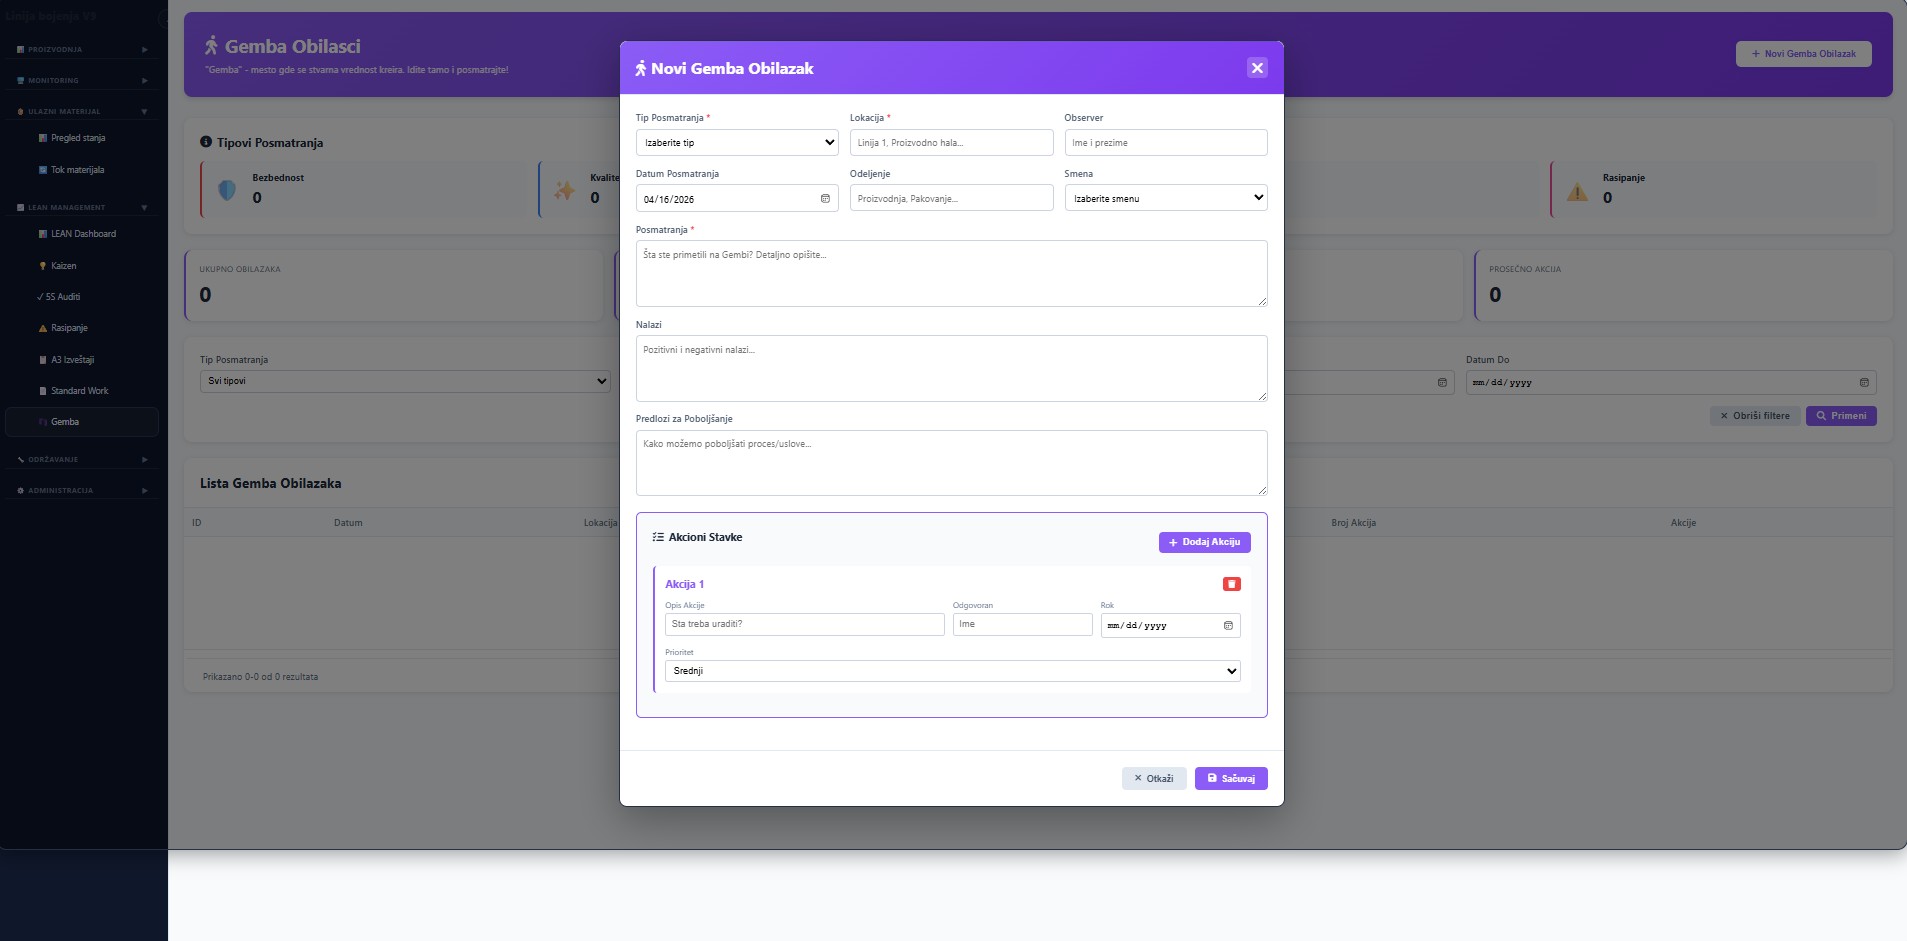
Figure 18 — New Gemba Walk: structured shop-floor walk form with observation type (Safety / Quality / Waste), location, shift, observations, findings (positive and negative) and improvement suggestions — with integrated action items including responsible persons and deadlines
3 observation types
Safety, Quality, Waste — sections are colour-coded, the team lead immediately sees which area dominates the walks.
Positive + negative findings
The form requires both — culture is not built solely on finding faults.
Actions directly from the walk
Every action item (Add Action) has a description, owner, deadline and priority — and automatically shows up in LEAN activities.
Linking to equipment
Location can be "Line 1, Production hall" or a specific asset from the equipment registry — a trail is built between LEAN and Maintenance.
View · 04
New A3 Report: Toyota A3 methodology for structured problem solving across 8 steps (Background → Current situation → Target → Root cause analysis → Countermeasures → Implementation plan → Follow-up → Results) with required fields for every A3 canvas quadrant
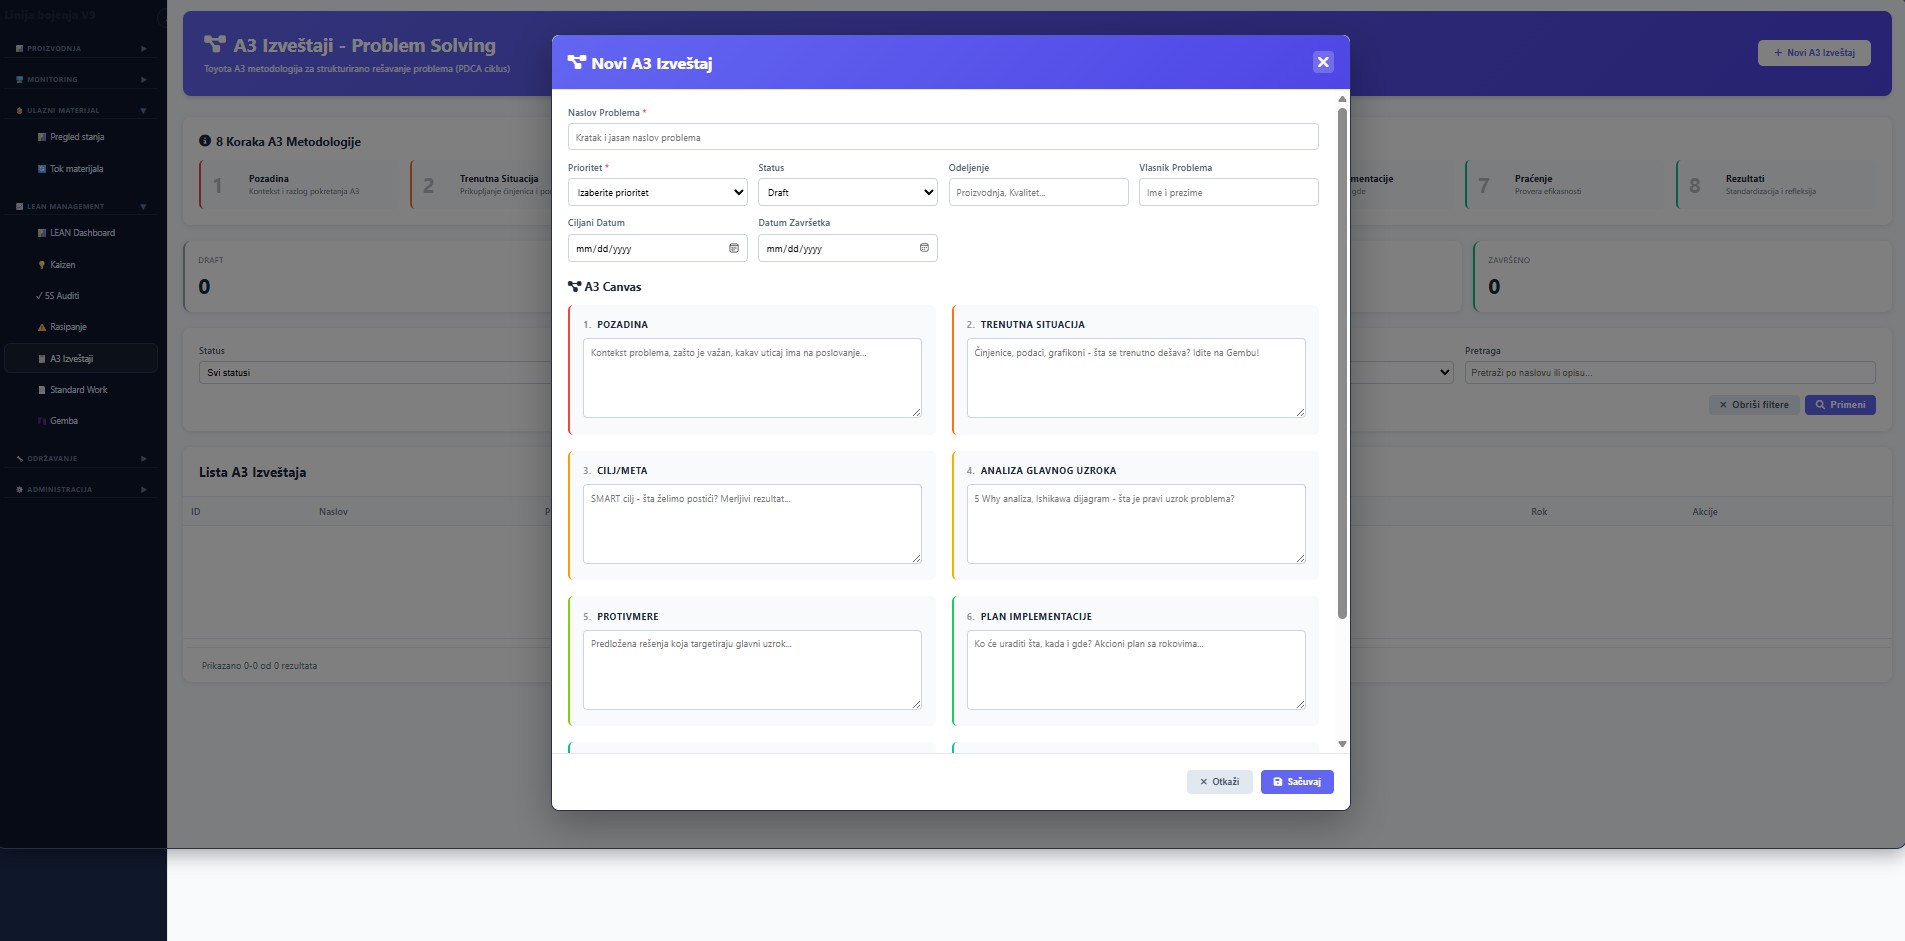
Figure 19 — New A3 Report: Toyota A3 methodology for structured problem solving across 8 steps (Background → Current situation → Target → Root cause analysis → Countermeasures → Implementation plan → Follow-up → Results) with required fields for every A3 canvas quadrant
8 steps of A3 methodology
Background, Current situation, Target, Root cause, Countermeasures, Implementation plan, Follow-up, Results — exactly per the Toyota PDCA cycle.
A3 Canvas visualization
Each of the 8 steps is visually separated as an A3 sheet quadrant — the team can simply print the report and post it on a shop-floor board.
Problem owner + Target date
Clear ownership from day one — no A3 reports "with no name".
5 Why, Ishikawa prompted
The cause-analysis placeholder explicitly suggests 5 Why and Ishikawa diagram — methodology is part of the form.
Ready to digitalize your production?
Schedule a 30-minute demo call. We will show you how CTRL works with your PLCs, your data, and your processes. The solution is fully customized and tailored — terms by agreement.