01 · Overview
Main dashboard
A central view of the entire production floor. The dashboard provides transparent insight into key indicators with drill-down analytics down to individual machine or operator level. Key indicators include current output per shift, plan completion (percent and volume), machine status (running, downtime, setup, maintenance), real-time OEE with decomposition, active downtime counts with Pareto analysis, scrap and rework overview, and output broken down by operator, line and product.
View · 01
Production / Dashboard: real-time production line overview with KPI cards (Input, Output, First Pass Yield, Quality, Item count, Paint/recipe count), work order table and output quantity & dimension charts
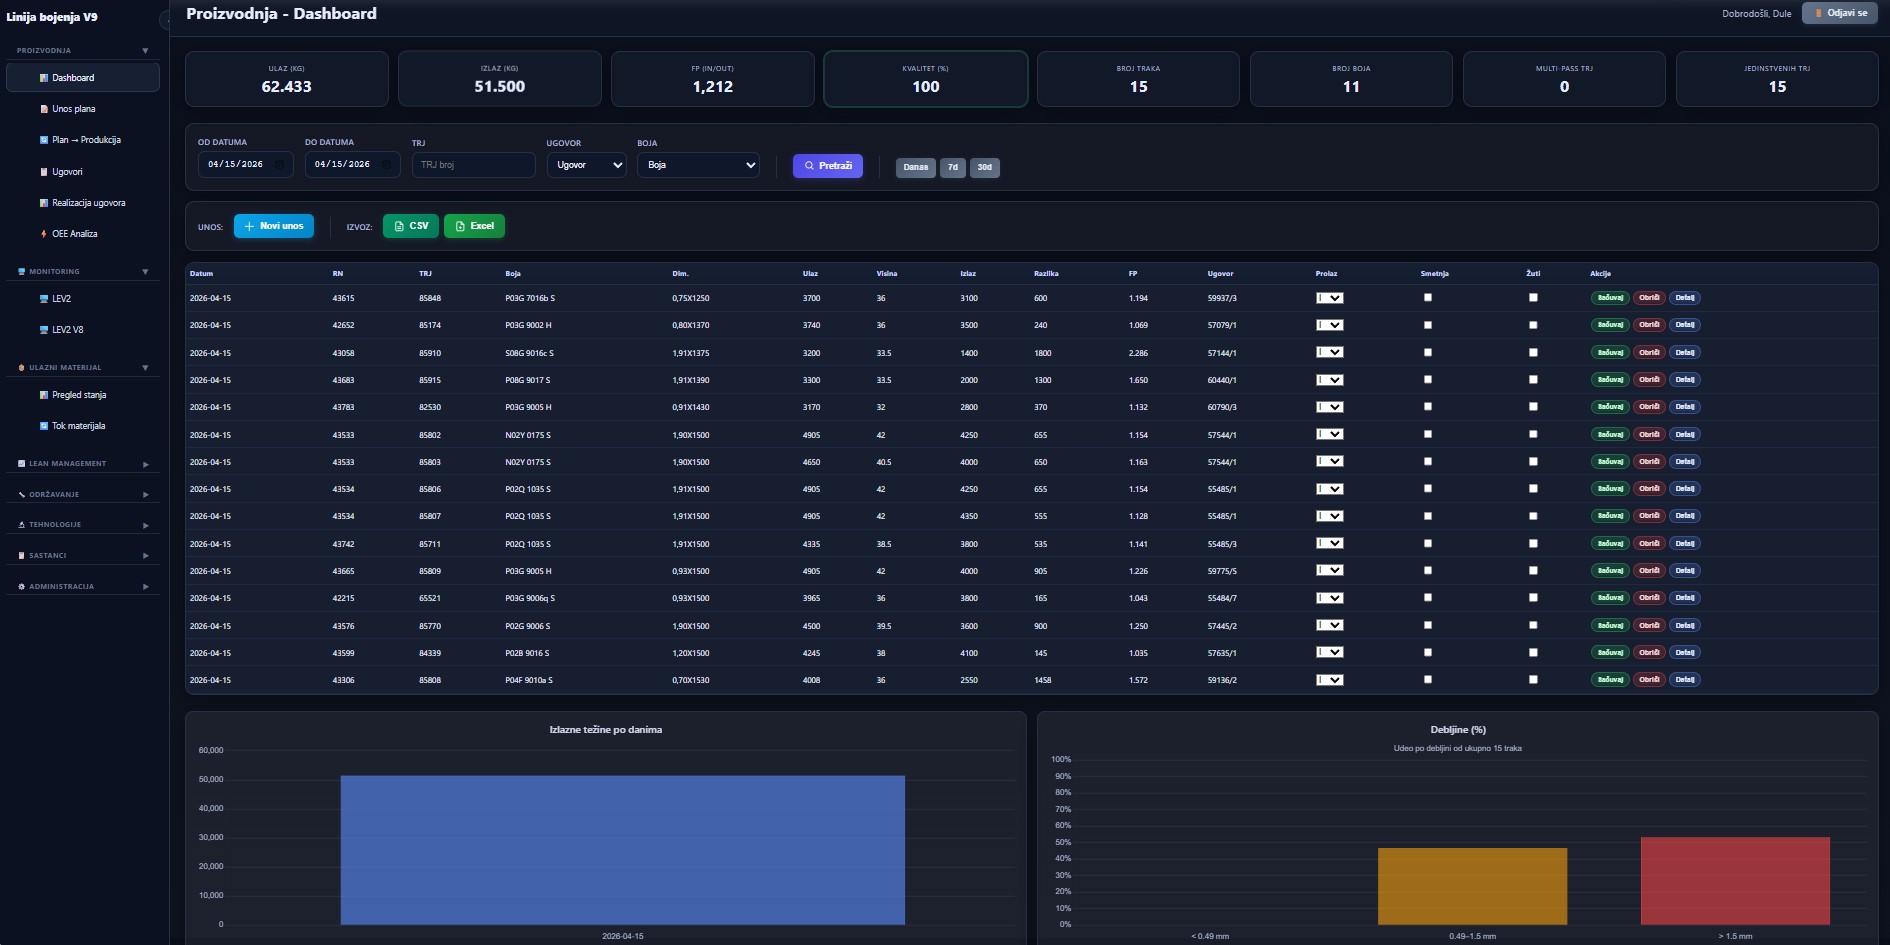
Figure 1 — Production / Dashboard: real-time production line overview with KPI cards (Input, Output, First Pass Yield, Quality, Item count, Paint/recipe count), work order table and output quantity & dimension charts
8 real-time KPI cards
Input, output, First Pass Yield, quality, item count, recipe count, Multi-pass items and Unique items — in kilograms and percentages.
Filter by date and contract
Quick presets — today, 7 days, 30 days — or a custom range by item ID, contract and recipe.
Work order table
Work order, item ID, recipe, dimensions, in / out / variance, First Pass Yield, contract, attention and interference flags — all in one view.
Charts and CSV / Excel export
Output quantities over time and dimension-parameter distribution, with one-click CSV or Excel export.
View · 02
LEAN Management System / Dashboard: 5 KPI cards (Active Kaizens, Average 5S score, Open Waste reports, Active A3 projects, Total Kaizens), a "Quick actions" section with 9 colour-coded buttons for frequent workflows, and 4 analytics panels (Kaizen Status Distribution, 5S Trends, Waste Pareto Analysis, Kaizen Implementation) plus a recent-activity feed
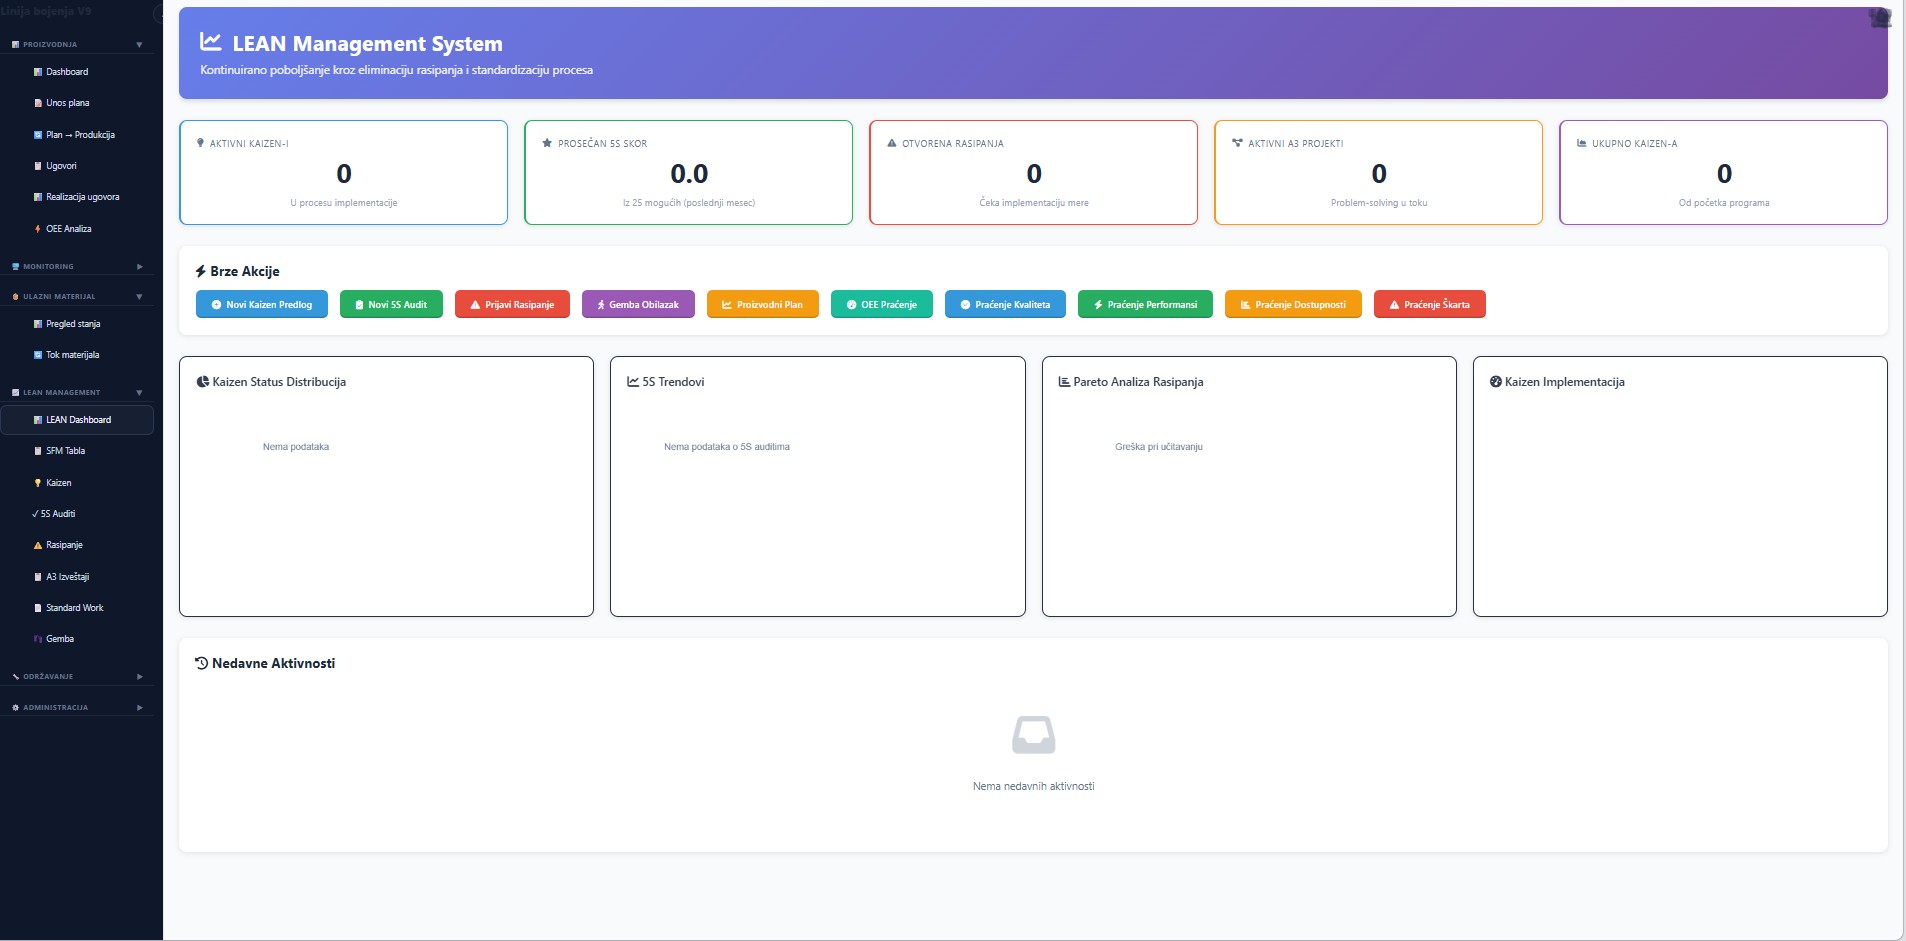
Figure 2 — LEAN Management System / Dashboard: 5 KPI cards (Active Kaizens, Average 5S score, Open Waste reports, Active A3 projects, Total Kaizens), a "Quick actions" section with 9 colour-coded buttons for frequent workflows, and 4 analytics panels (Kaizen Status Distribution, 5S Trends, Waste Pareto Analysis, Kaizen Implementation) plus a recent-activity feed
5 LEAN KPI cards
Active Kaizens (in implementation), Average 5S score (out of 25 possible), Open waste reports (awaiting action), Active A3 projects, Total Kaizens since program start.
Quick actions in one row
New Kaizen, New 5S Audit, Report Waste, Gemba Walk, Production Plan, OEE Tracking, Quality / Performance / Availability / Scrap Tracking — the most common workflows are one click away.
4 analytics panels
Kaizen Status Distribution (Draft/Submitted/Approved/Implemented), 5S Trends, Waste Pareto Analysis, Kaizen Implementation — all on one screen.
Recent-activity feed
A live log of when someone submitted a Kaizen, reported waste or completed a 5S audit — nobody misses LEAN team activity.
Ready to digitalize your production?
Schedule a 30-minute demo call. We will show you how CTRL works with your PLCs, your data, and your processes. The solution is fully customized and tailored — terms by agreement.